One may think that the characteristics of poverty within Syracuse span all regions of the city. In reality, when you look deeper you can see that the challenges and opportunities experienced by residents vary based on neighborhood. It can be difficult for social programs to succeed in their efforts to decrease poverty if they are not addressing the nuances within the areas where they work.
<p”>This paper examines how the use of precise measurements within a poverty index, which compares each tract along multiple dimensions that reinforce one another, can drive meaningful change through holistic yet customized neighborhood solutions.
Written by Frank Ridzi, PhD., Vice President, Community Investment
and Jamison Crawford, MPA, Data Science Consultant
Introduction
Recent studies based on federal data have helped Central New York residents to recognize our region’s concentrated poverty problem. But to solve this systemic problem strategically, we need to leverage local data to identify the unique characteristics within a neighborhood. In this paper we examine three Syracuse neighborhoods that federal data identify as having the same high rate of poverty. From there, we delve into local data to reveal that each community has significantly different strengths and challenges. Our conclusion is that by utilizing local data, we are in a unique position to construct holistic and customized neighborhood solutions that drive meaningful change. Furthermore, these data will allow us to see when positive changes occur.
why measure poverty?
In 2015, a national study on high-poverty neighborhoods conducted by Dr. Paul Jargowski of the Century Foundation showed that of the 100 largest metropolitan areas in the United States, Syracuse, New York had the highest concentrated poverty among African American and Latino residents. The city was also in the top ten metropolitan areas for concentrated poverty among White residents (Jargowsky, 2015). In response, several local interventions – such as Greater Syracuse H.O.P.E. and the Alliance for Economic Inclusion (AEI) – have been initiated over the past three years to decrease the city’s poverty rate. These calls to action have raised important questions as to the best way to decrease concentrated poverty and measure effectiveness.
geography matters: how we respond should not be ‘one size fits all’
The study of poverty over geographic areas gained prominence in the late 1980s, when a landmark study, The Truly Disadvantaged, analyzed the constraints and opportunities of concentrated poverty. These so-called ‘concentration effects’ of living in a neighborhood in which the population is overwhelmingly socially disadvantaged were found to be associated with intergenerational poverty, neighborhood crime, poor labor force attachment, and other challenges (Wilson, 1987). Concentration effects also include a tendency toward more single-parent households, unemployment, financial hardship, wage disparity, lack of reliable transportation, and limited access to information about jobs. Schools and academic outcomes are negatively affected by concentration effects such as unsustainable commutes, lower expectations of teachers, fewer available resources, and more disruptive peers (Jargowsky, 2013).
Health outcomes can also be negatively impacted by concentrated poverty due to fewer parks, less greenspace and recreation venues, increased exposure to alcohol and tobacco, and higher rates of both communicable and preventable diseases, such as type 2 diabetes, obesity, and premature births (Jargowsky, 2013). Children are most affected by concentrated poverty and are even more likely to live in high-poverty neighborhoods than adults (Jargowsky, 2013). This is especially problematic since there is a growing body of research indicating that the neighborhood where a child grows up plays a critical role in their success later in life, including chances of upward income mobility (Chetty et al. 2018). Together, these aspects of concentrated poverty can often produce a vicious cycle in which each disadvantage reinforces and magnifies others. In other words, key neighborhood dynamics of crime, education, employment, welfare services, housing conditions and job opportunities all interact in complex ways to bring about and maintain poverty. If we are to reverse these dynamics and shift toward a virtuous cycle (in which positive outcomes in various areas foster improved outcomes in others) we need to assess and evaluate all of these dynamics at once.
Because concentrated poverty and concentration effects – whether positive or negative – are traditionally measured by census tract, a ‘poverty index,’ which compares the effects of each tract along multiple dimensions that reinforce one another, offers perhaps our greatest opportunity for determining customized solutions and tracking progress.
envisioning a syracuse poverty index: diagnosing each neighborhood’s needs to prescribe solutions
In his influential work, Paul Jargowsky (2015:2) defined concentrated poverty as “census tracts where the federal poverty rate was 40 percent or more.” Based on the literature noted above, we can assume a lot about such communities. However, if we are to move beyond assumptions and into planning courses of action (and eventually measuring their success), we must move away from the occasional estimates that the census provides and toward more timely, concrete counts from local government. To illustrate, let’s look at three neighborhoods through the lens of a poverty index, which compares variables within a concentrated area.
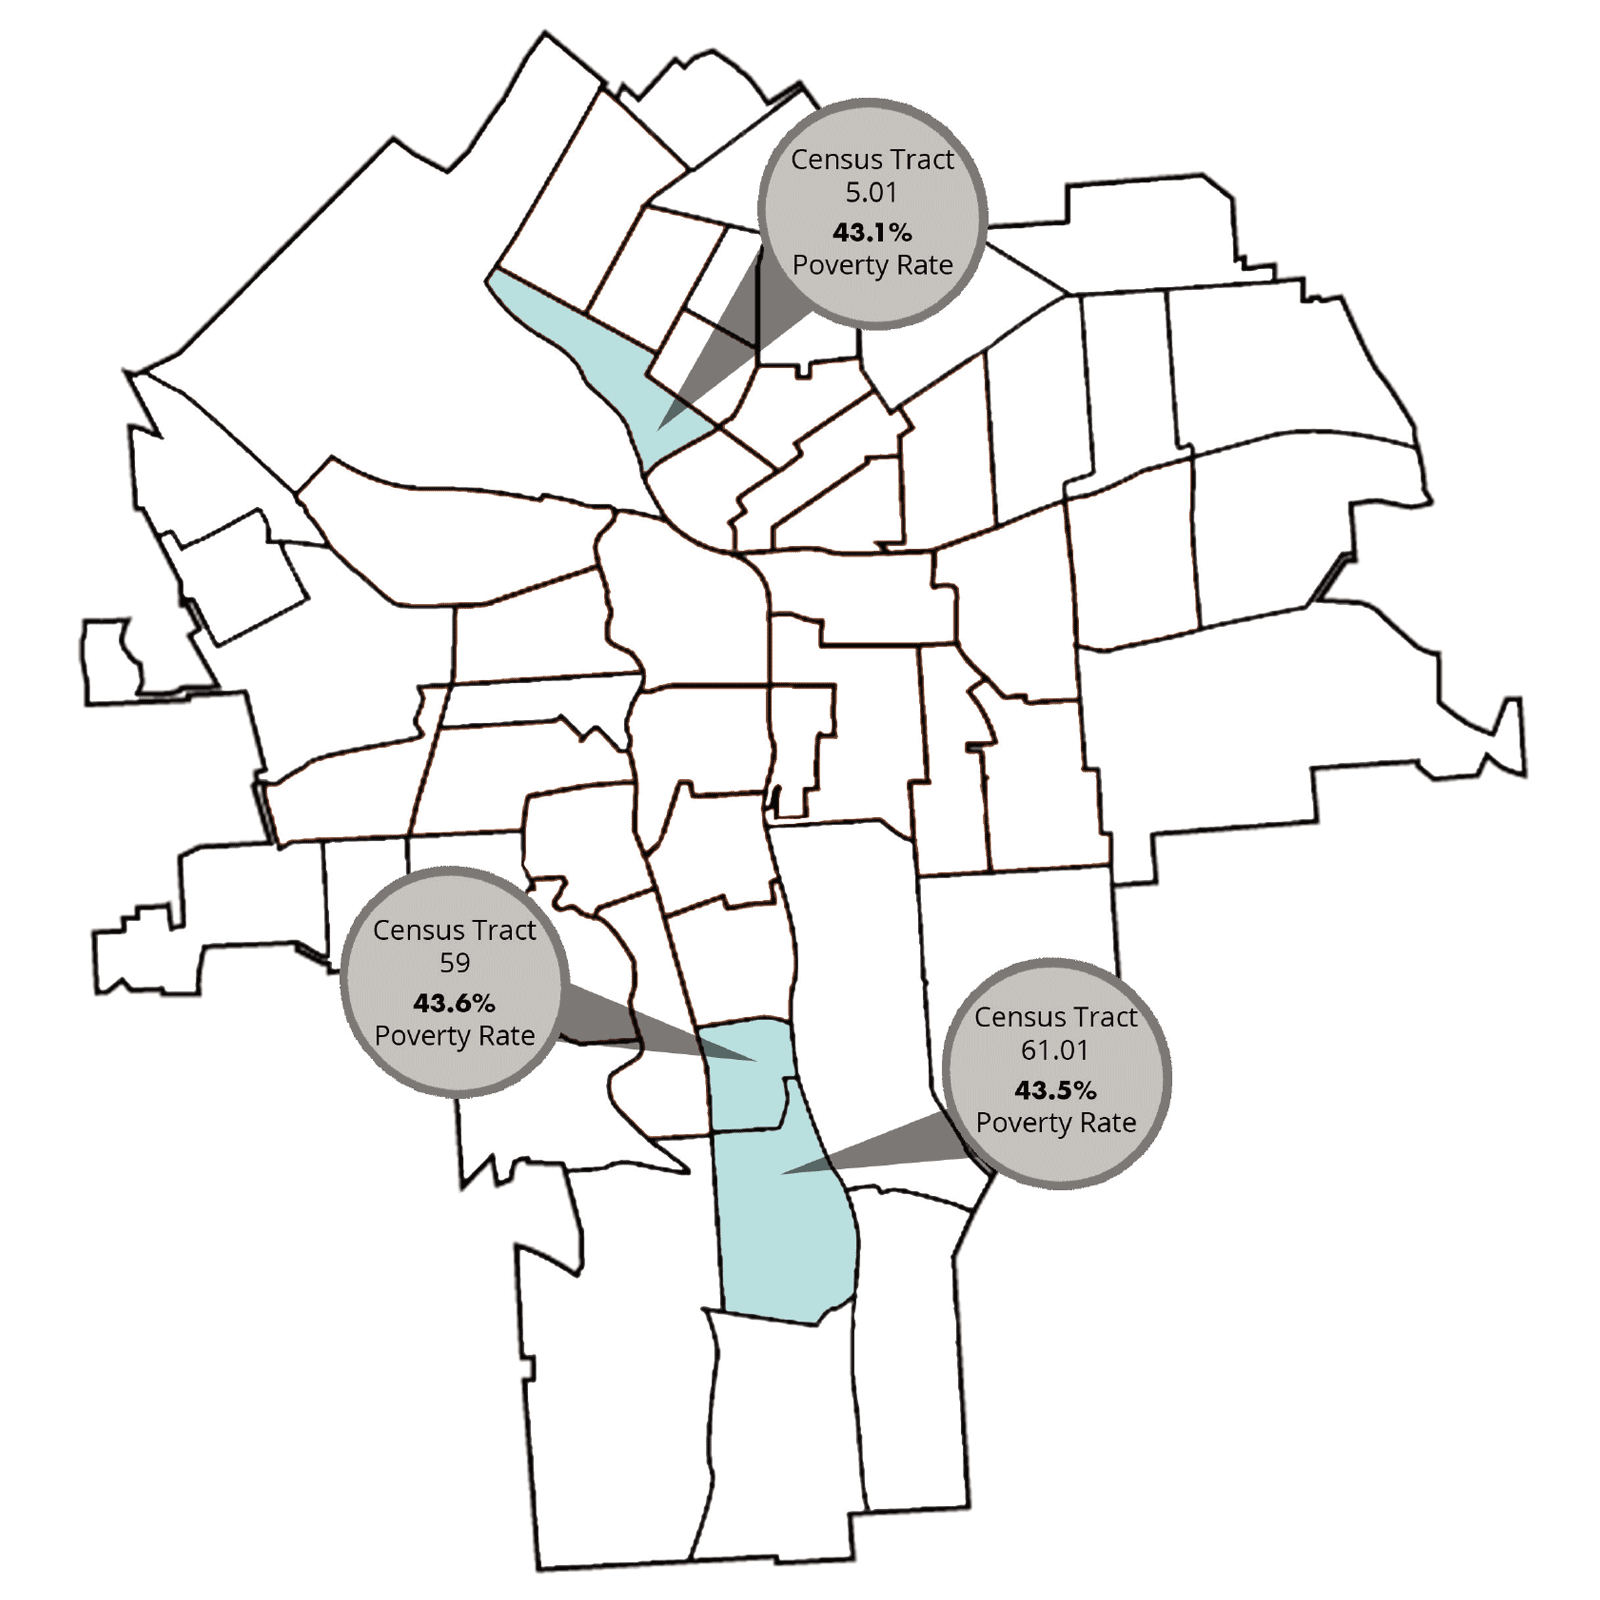
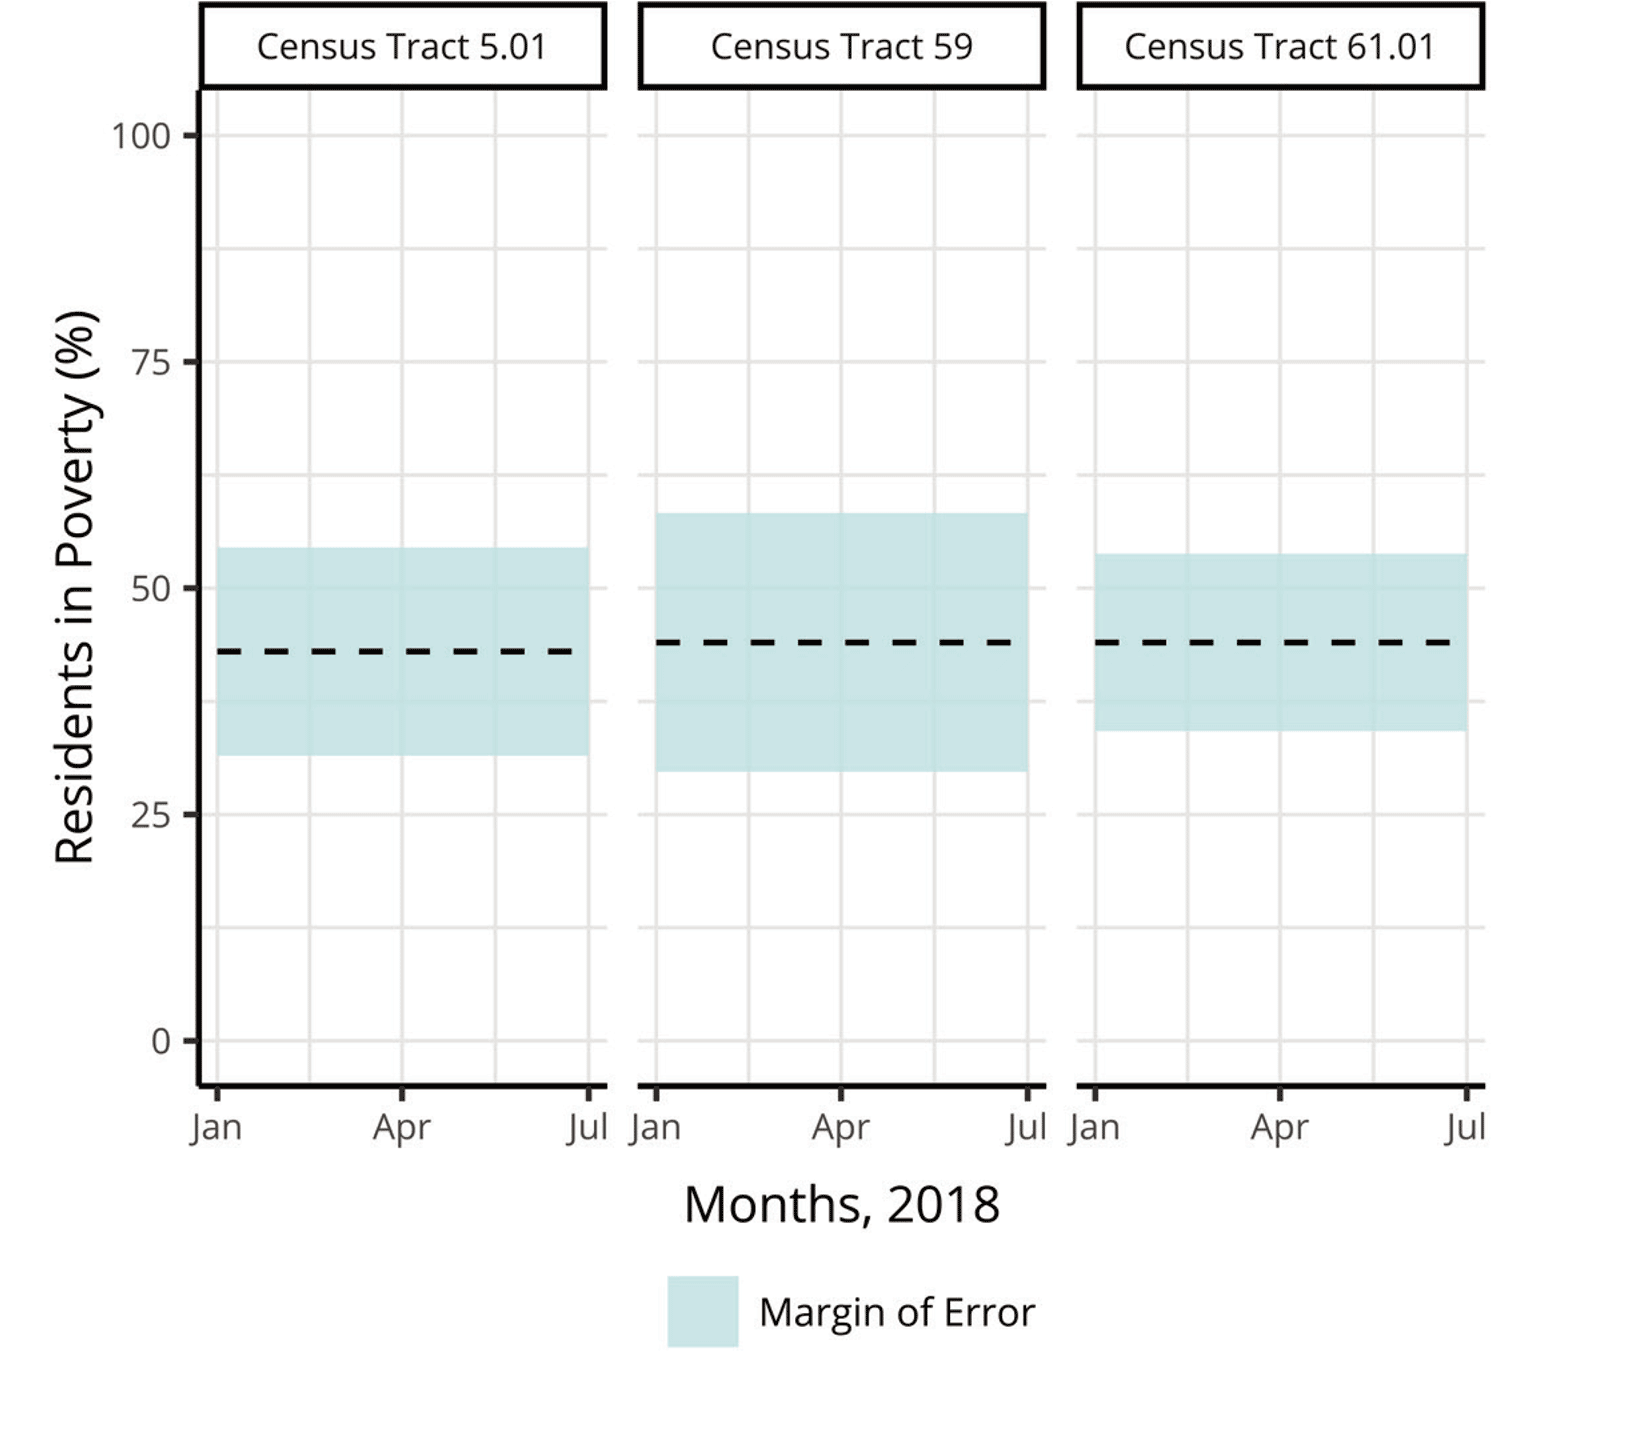
According to Census Reporter, all three neighborhoods had a poverty rate of around 43% in 2017 (see Table 1). However, looking deeper, these three areas located on the Northside, Southside and far Southside of the city have nuances that only become visible when we utilize more precise data.
City of Syracuse Census Tracts: Three Neighborhoods with Similar Poverty Levels
Table 1: Poverty Rates by Census Tracts
| Census Tract | Poverty Rate (%) | Margin of Error (%) |
|---|---|---|
| 5.01 | 43.1 | ± 11.5 |
| 59 | 43.6 | ± 14.3 |
| 61.01 | 43.5 | ± 9.8 |
Source: Census Reporter

Crime
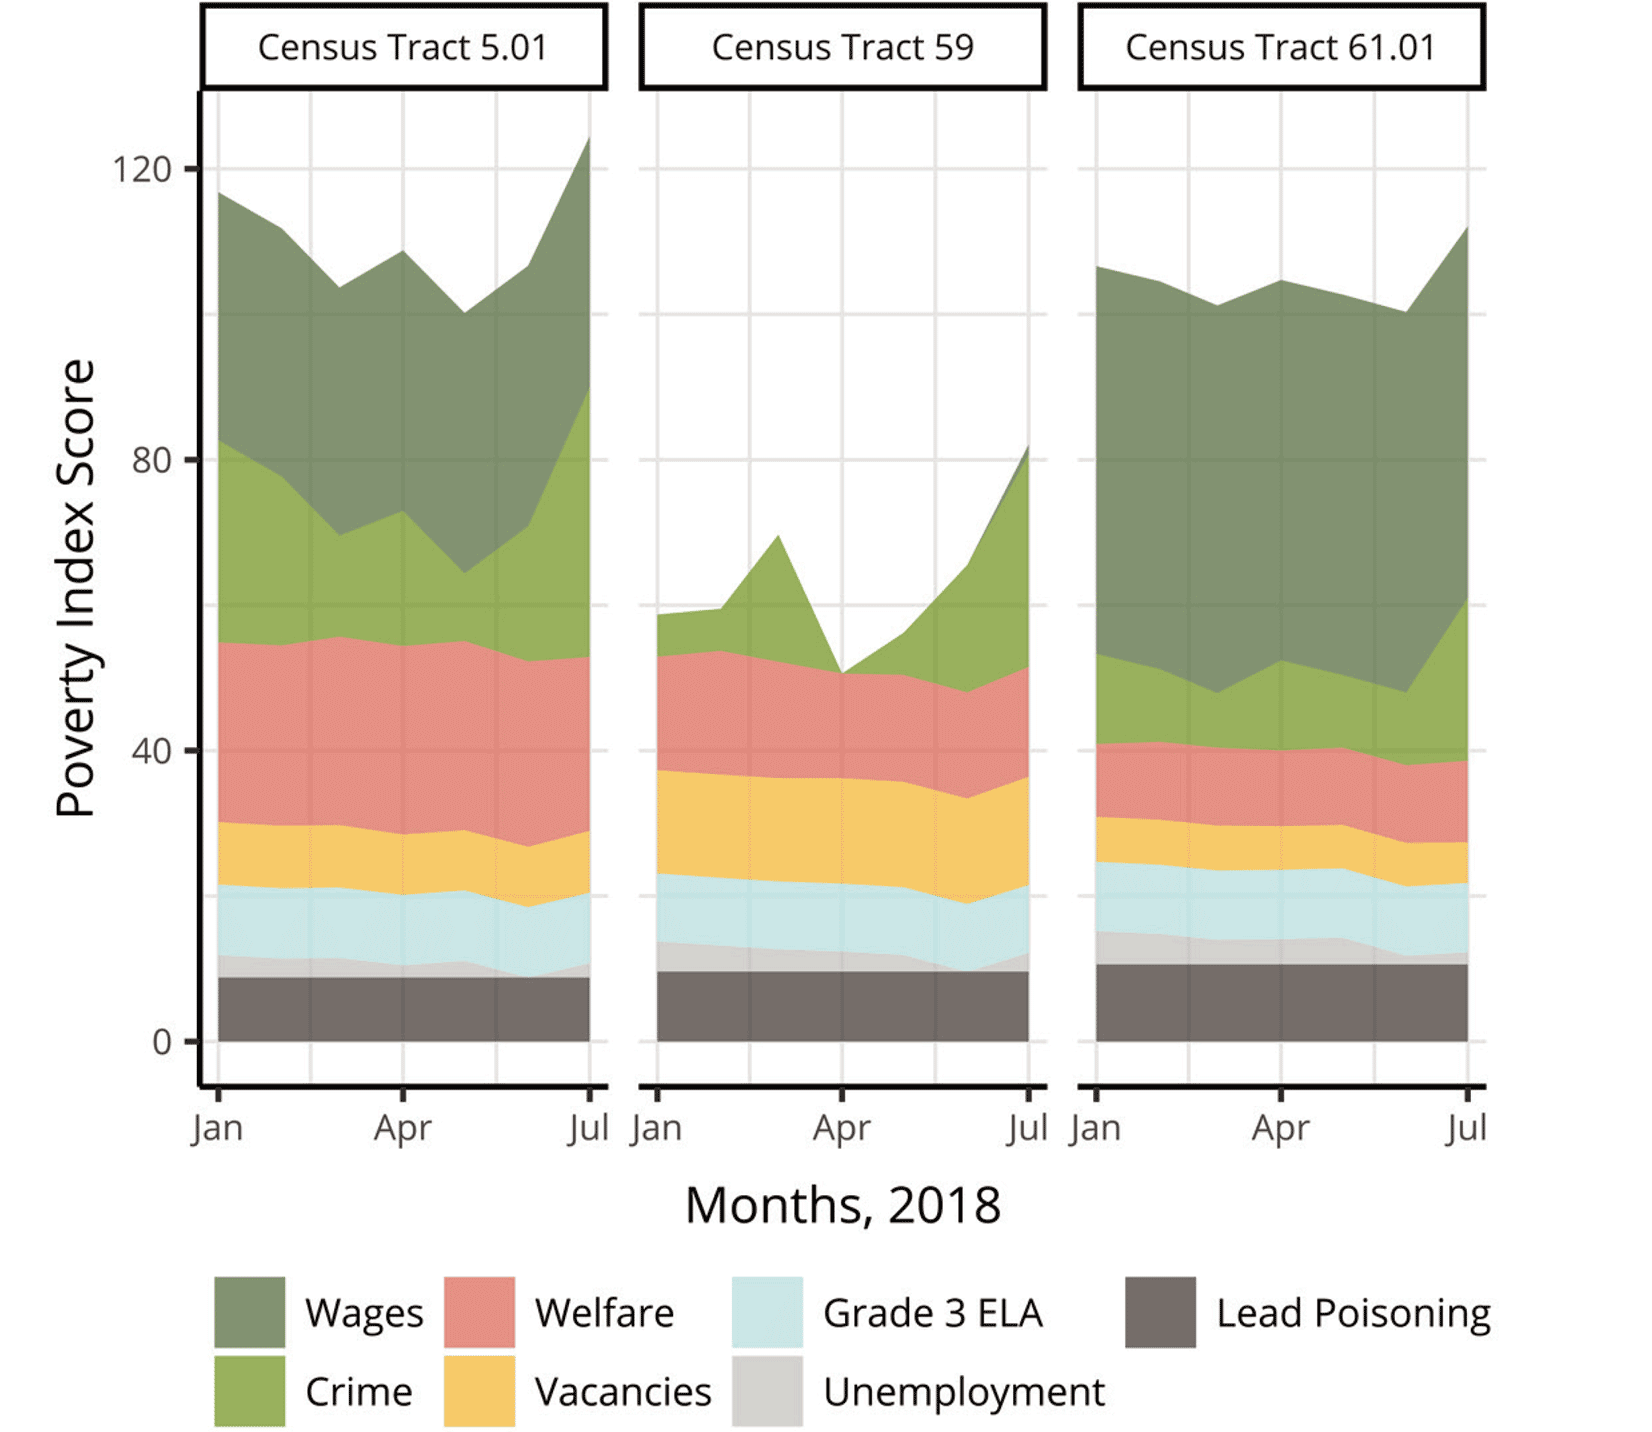
The safer an area, the better the quality of life for its residents, and the more vibrant a community can become. As safety increases, there is greater opportunity for more neighborhood events, increased connections between neighbors, and a heightened use of area parks and outdoor spaces. When analyzing the data, Tract 59 only experiences half of the crime rate that is common during peak months in the other two tracts. This begs a question: What are they doing well that could be replicated in other neighborhoods?
English Language Arts
The ability to read proficiently directly influences all other areas of a child’s education. Until third grade, students are typically learning to read, while after third grade, students are reading to learn. Therefore, a student who is not able to read proficiently by third grade may also struggle in other subjects like math and science. Third grade level reading rates continue to be a challenge across the city and these tracts are no exception, but the city as a whole has seen a remarkable improvement of nearly 10 percent in the past two years. Unfortunately, all three of these neighborhoods have been left out of the positive upward trend – they are all worse than the city average – so they could benefit from extensive intervention in this area.
Unemployment
Unemployment insurance is temporary income for those who lost their jobs, are ready and able to work, and who are actively seeking employment on a weekly basis. Unemployment may be related to skills gaps, limited options for a person who was previously incarcerated, a lack of transportation to locations where jobs are available, or a lack of knowledge about employment opportunities. Tract 61.01 tends to have twice as many people on unemployment than the other two neighborhoods, which have rates closer to the city average. This is as much an opportunity as a challenge because qualifying for unemployment requires individuals to hold jobs within the past 6 months. This makes it easier to reconnect them to the workforce than those who are long-term unemployed or chronically in poverty. This might be a prime target neighborhood for job re-training or employer intermediary services.
Public Assistance
Many families on public assistance will often choose to eat less or buy cheaper, less healthy food in order to pay for rent, utilities and other necessities. Tract 5.01 has twice as many people receiving public assistance than the other two neighborhoods this analysis considers, which are closer to the city average. Depending on what dynamics are at play behind these numbers, this might be a prime target neighborhood for a variety of services such as job training and nutrition related assistance. To know for sure would require further investigation and conversations with residents.
Vacancies
Vacant units are defined as unoccupied homes with an owner. Vacant and abandoned properties can lead to higher crime rates, sharply decreasing property values and health risks to surrounding neighbors. The rate of vacancies is a key quality of life issue and while two neighborhoods are stable with around 50 per quarter, Tract 59 is on the rise, jumping from 68 to 82. Perhaps action in the form of housing redevelopment can be taken to turn this trend around.
Employment & Wages
Residents with low incomes hold lower purchasing power, often finding themselves living paycheck-to-paycheck, and may be struggling to maintain a comfortable quality of life for families. When it comes to employment opportunities, these three communities are in different places. Tract 61.01 has the lowest paying jobs, while Tract 5.01 is roughly double and Tract 59 is roughly triple that of 61.01. This is a measure of wages paid by employers in these neighborhoods and not wages earned by residents. While many people do not work in the neighborhood they live in, these numbers suggest much more opportunity for upward mobility in Tract 59 thanks to a more booming business community. Without businesses there are no jobs!
Combining All Factors Into An Index
Above we have looked at the different components of a poverty index (crime, education, employment, welfare services, housing conditions and job opportunities) individually and how they each offer unique vantage points into the nuances of daily life in our three neighborhoods. However, if we only look at these components in isolation, we would miss out on an opportunity to work together across sectors to reinforce and multiply the impact of each other’s positive work. Furthermore, we miss out on the power of observing how positive changes in one area of community life may also reinforce improvements in others.
For instance, when we look at the examples explained above in the form of a holistic poverty index, we can see that Tract 5.01 has more overall challenges to deal with than Tract 59. If efforts are made to invest in this neighborhood by groups that focus on crime prevention, educational supports, workforce supports, and business development, we may be fortunate enough to see individual local indicators move in a positive direction. However, unless we combine these data into an index, we will not be able to monitor, coordinate and inspire the holistic transformation of a neighborhood that can happen when concerted efforts reinforce one another and magnify each other’s positive impact.
Table 2: Resolutions of the Poverty Index

Table 3: Limitations of the U.S. Census Poverty Rate

This index is created by first standardizing each measure so that they are proportional to each other and then combining them. For each category, higher numbers indicate worse conditions. Any area not shown on the graph represents no gap present. For further details please see the following source: Crawford, Jamison, and Frank Ridzi (2019). “Meaningful, Manageable, and Moveable: Lessons Learned from Building a Local Poverty Index.”
Conclusion
The analysis shared in this paper demonstrates the potential of local data to develop a more precise understanding of how our neighborhoods are doing. Positive change will require reaching out to families that reside in these neighborhoods to co-create the changes we hope to see. However, it is not feasible to reach out to every resident all of the time. What local data such as the above can do is highlight the key strengths and challenges of a neighborhood and help to give those discussions a concrete focus and a baseline that will allow us to measure community improvement.
To truly create data-driven neighborhood solutions, we, as a community, must embolden and support organizations that evaluate this way. They should be encouraged to use local data, such as the metrics used in this sample poverty index and information shared by residents about their own life needs, to dig deep into the uniqueness of the neighborhoods they serve. They can then use these insights to build out leading indicators that will enable cross-sector collaboration, predict areas of need and monitor whether local conditions are moving in the right direction. This will require investments in our community’s capacity – including technical skills – to gather and share these data as well as the development of trusting partnerships between the different institutions that safeguard them.
Each of us has a role to play and can take action by asking our elected officials and policymakers to share data at this level (and praising them when they do), encouraging creative solutions at the neighborhood-specific level and supporting coalitions that work by addressing multiple sectors to solve a problem. Poverty is nuanced and one neighborhood is not like the others. We need to use data to tell a story that breaks through the stigma and offers concrete insights into our progress.
References
- Chetty, Raj with John Friedman, Nathaniel Hendren, Maggie R. Jones, and Sonya R. Porter. (2018) “The Opportunity Atlas: Mapping the Childhood Roots of Social Mobility” NBER Working Paper No. 25147 (September 2018), https://opportunityinsights.org/paper/the-opportunity-atlas/
- Jargowsky, Paul A. (2015). “Architecture of Segregation: Civil Unrest, the Concentration of Poverty, and Public Policy.” The Century Foundation. Retrieved on June 9, 2019 from https://tcf.org/content/report/architecture-of-segregation/?agreed=1
- Wilson, William Julius (1987). “The Truly Disadvantaged.” University of Chicago Press.
